Case Study: When Machine Learning Beats Regression — and What That Actually Tells You
A random forest beat logistic regression on 300 patients. The right response was not to use the forest — it was to work out what the regression was missing. Worked end to end in Inference Stats.
Most comparisons of machine learning against regression in clinical journals end one of two ways. Either the flexible model wins and is declared the future, or it loses and the paper concludes that regression is fine after all. Both readings skip the interesting question: why did one beat the other?
This is a worked example where the forest won, on 300 patients, and where the right response was not to use the forest.
The data
300 patients, a binary outcome (died), and two predictors: age and sex. Twenty-two
events. The kind of small, wide-ish, unbalanced dataset that clinical prediction work is
actually made of, rather than the kind machine learning benchmarks are made of.
What the tournament said
The Auto Model Tournament fits every candidate through the same 5-fold stratified cross-validation, with logistic regression entered as the benchmark rather than as one more contestant. On this data:
| Model | AUROC | Brier score | Accuracy |
|---|---|---|---|
| gaussianNB (recommended) | 0.677 ± 0.129 | 0.067 ± 0.007 | 0.927 ± 0.009 |
| randomForest | 0.676 ± 0.135 | 0.069 ± 0.007 | 0.927 ± 0.009 |
| knn | 0.560 ± 0.186 | 0.077 ± 0.010 | 0.923 ± 0.015 |
| logistic (benchmark) | 0.531 ± 0.108 | 0.068 ± 0.007 | 0.927 ± 0.009 |
The benchmark scored 0.531 — barely above a coin toss. Two flexible models cleared it by about 0.14 AUROC, past the one-standard-deviation noise band, and the tool recommended one of them over the baseline.
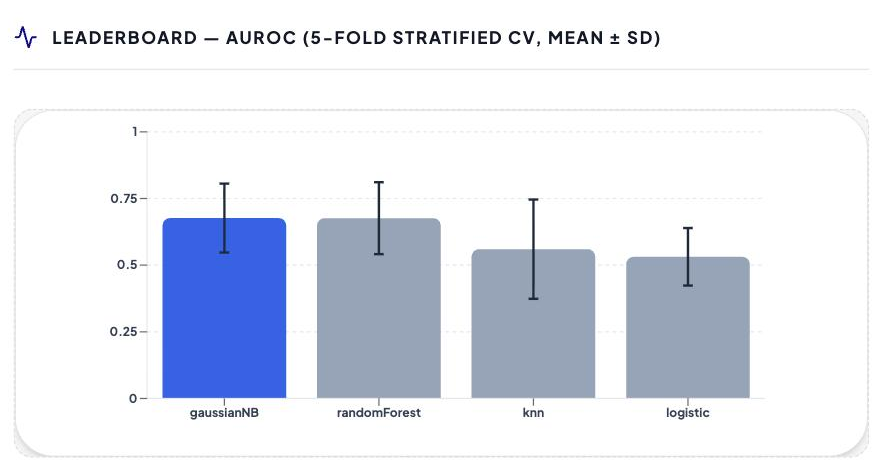
The error bars are the part to look at. Every interval overlaps every other one — which is what 22 events buys you, and why the ranking below is a lead to follow rather than a verdict.
Notice what accuracy does here: every model reports 0.927, because 278 of 300 patients survived and predicting "survives" for everyone gets you 0.927. Accuracy is the number that looks best and says least. That is why the leaderboard is ranked on AUROC and reports the Brier score beside it.
The finding is not "use a forest"
A linear logistic model can only bend one way. If the true relationship between age and risk is monotone, it will find it. If risk falls and then rises, a straight line through it is nearly flat — which is exactly what an AUROC of 0.53 looks like.
So the tournament result is a specification finding, not a model-selection finding. The forest did not know something clever; the regression was asked the wrong question.
This is the honest reading of most "ML beats regression" results on tabular clinical data, and it is the reason the tournament states its own caveat before you read the leaderboard:
Random forest and kNN are untuned defaults. On tabular data of this size a flexible model beating the benchmark is the exception, not the rule — if it does not win here, that is a finding, not a failure to tune.
Here it did win. The next step is to find out what it saw.
What the forest could tell us
Two things a regression cannot produce, both shown alongside the leaderboard:
Out-of-bag accuracy: 0.9267, from 150 trees over 300 rows — every row scored using only the trees that never saw it. An out-of-sample estimate that costs no data and no extra fitting.
Permutation importance, computed out of bag: shuffle a column among the rows a tree did not see, and measure how much worse that tree gets. On this data every importance came back within ±0.002 of zero, and the tool said so rather than letting the bar chart be read:
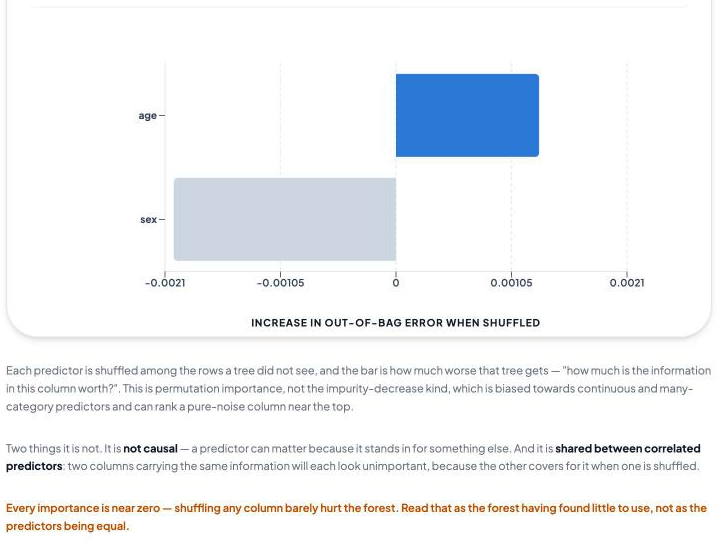
Read the axis before the bars. It runs from −0.0021 to +0.0021: shuffling either column
changes the forest's error rate in the fourth decimal place. sex comes out slightly
negative — shuffling it made the forest marginally better, which is what noise looks
like, and the bar is greyed rather than hidden so it is visible as having landed at zero.
That warning matters. With 22 events in 300 patients, the forest predicts "survives" almost everywhere, so shuffling a column barely moves its error rate. A bar chart of noise, ranked, looks exactly like a finding.
Two further limits are stated on the figure rather than left to the reader: permutation importance is not causal, and it is shared between correlated predictors — two columns carrying the same information will each look unimportant, because the other covers for it when one is shuffled.
The fix keeps the regression
Rather than reporting the forest, we went back to the logistic model and let age bend, using a restricted cubic spline. The tool chose the number of knots by the Akaike information criterion:
| Knots | AIC | Δ AIC | Log-likelihood |
|---|---|---|---|
| 3 | 152.43 | 3.40 | −72.213 |
| 4 ✓ | 149.02 | 0.00 | −69.512 |
| 5 | 149.06 | 0.04 | −68.530 |
Four knots won, placed at the 5th, 35th, 65th and 95th percentiles of age — 22.70, 39.77, 57.07 and 75.77 — and the fitted curve showed the shape the straight line could not: risk high at the youngest ages, falling through middle age, rising again in the oldest patients.
The tool also flagged that the win was not clean: 5 knots sat 0.04 AIC behind, well inside the two-unit band where two models are not distinguishable. The draft methods sentence it generates says so in as many words, rather than implying the 4-knot model was clearly best.
The result is a model that sees what the forest saw, and still has coefficients, confidence intervals and a curve you can put in a paper.
What we would report
- The relationship between age and mortality is non-linear — that is the finding.
- It was modelled with a restricted cubic spline, 4 knots, chosen by AIC, with the tie against 5 knots declared.
- The predicted probability is presented as a curve with a 95% band computed on the log-odds scale and back-transformed, so it cannot leave 0–1.
- The forest is reported as what it was: a diagnostic that the linear specification was wrong, not the model of record.
What we would not report
The AUROCs, as though they settled anything. Look at the spreads: ±0.13 on the winner and ±0.11 on the benchmark, from 22 events. Cross-validation on this many events gives a number with a wide interval around it, and two models a tenth of an AUROC apart on 300 patients is a hypothesis, not a result.
The forest's out-of-bag accuracy as model performance. It is an internal estimate on the fitting data. The leaderboard cross-validates the whole pipeline; that is the number to quote, and even it is internal validation, not external.
Anything about which predictor matters most. The importance chart said, correctly, that it could not tell.
Every number above was produced by Inference Stats on the same dataset, in the ML and Regression tabs. The tournament, the out-of-bag estimates, the permutation importance and the spline are all Pro features.
Written by Dr Hoong Sern Lim MB ChB MD FRCP, Consultant Cardiologist, Queen Elizabeth Hospital Birmingham; Honorary Senior Lecturer, University of Birmingham. ORCID 0000-0002-6569-1805