Kruskal-Wallis vs ANOVA: Which Test Should You Use?
When to use Kruskal-Wallis instead of one-way ANOVA — skewed data, ordinal outcomes, outliers — with worked examples, post-hoc tests, and effect sizes.
You have three or more groups and one outcome, and you want to know whether the groups differ. One-way ANOVA is the textbook answer — but if your data is skewed, ordinal, or riddled with outliers, the Kruskal-Wallis test is often the safer choice. Here's how to decide in practice.
The short answer
Use one-way ANOVA when your outcome is continuous and roughly normally distributed within each group. Use Kruskal-Wallis when the outcome is heavily skewed, ordinal (like a pain score or satisfaction rating), or when outliers would dominate the means. If your only problem is unequal variances with reasonably normal data, there's a third option many people miss: Welch's ANOVA, which handles unequal spread without giving up means.
What each test actually compares
ANOVA compares means. It asks: is the variation between group means large relative to the variation within groups? That's exactly what you want when the mean is a meaningful summary of your data.
Kruskal-Wallis replaces every value with its rank in the pooled sample and asks whether the ranks in one group tend to be higher than in another. It doesn't compare means or (strictly) medians — it detects whether one group's distribution is shifted relative to the others. Because ranks don't care how extreme an outlier is, a length-of-stay of 180 days counts no more than one of 40 days.
A concrete example: hospital length of stay
Length of stay is a classic skewed variable — most patients go home in a few days, a few stay for months. Here are 270 patients across three wards, plotted in Inference Stats:
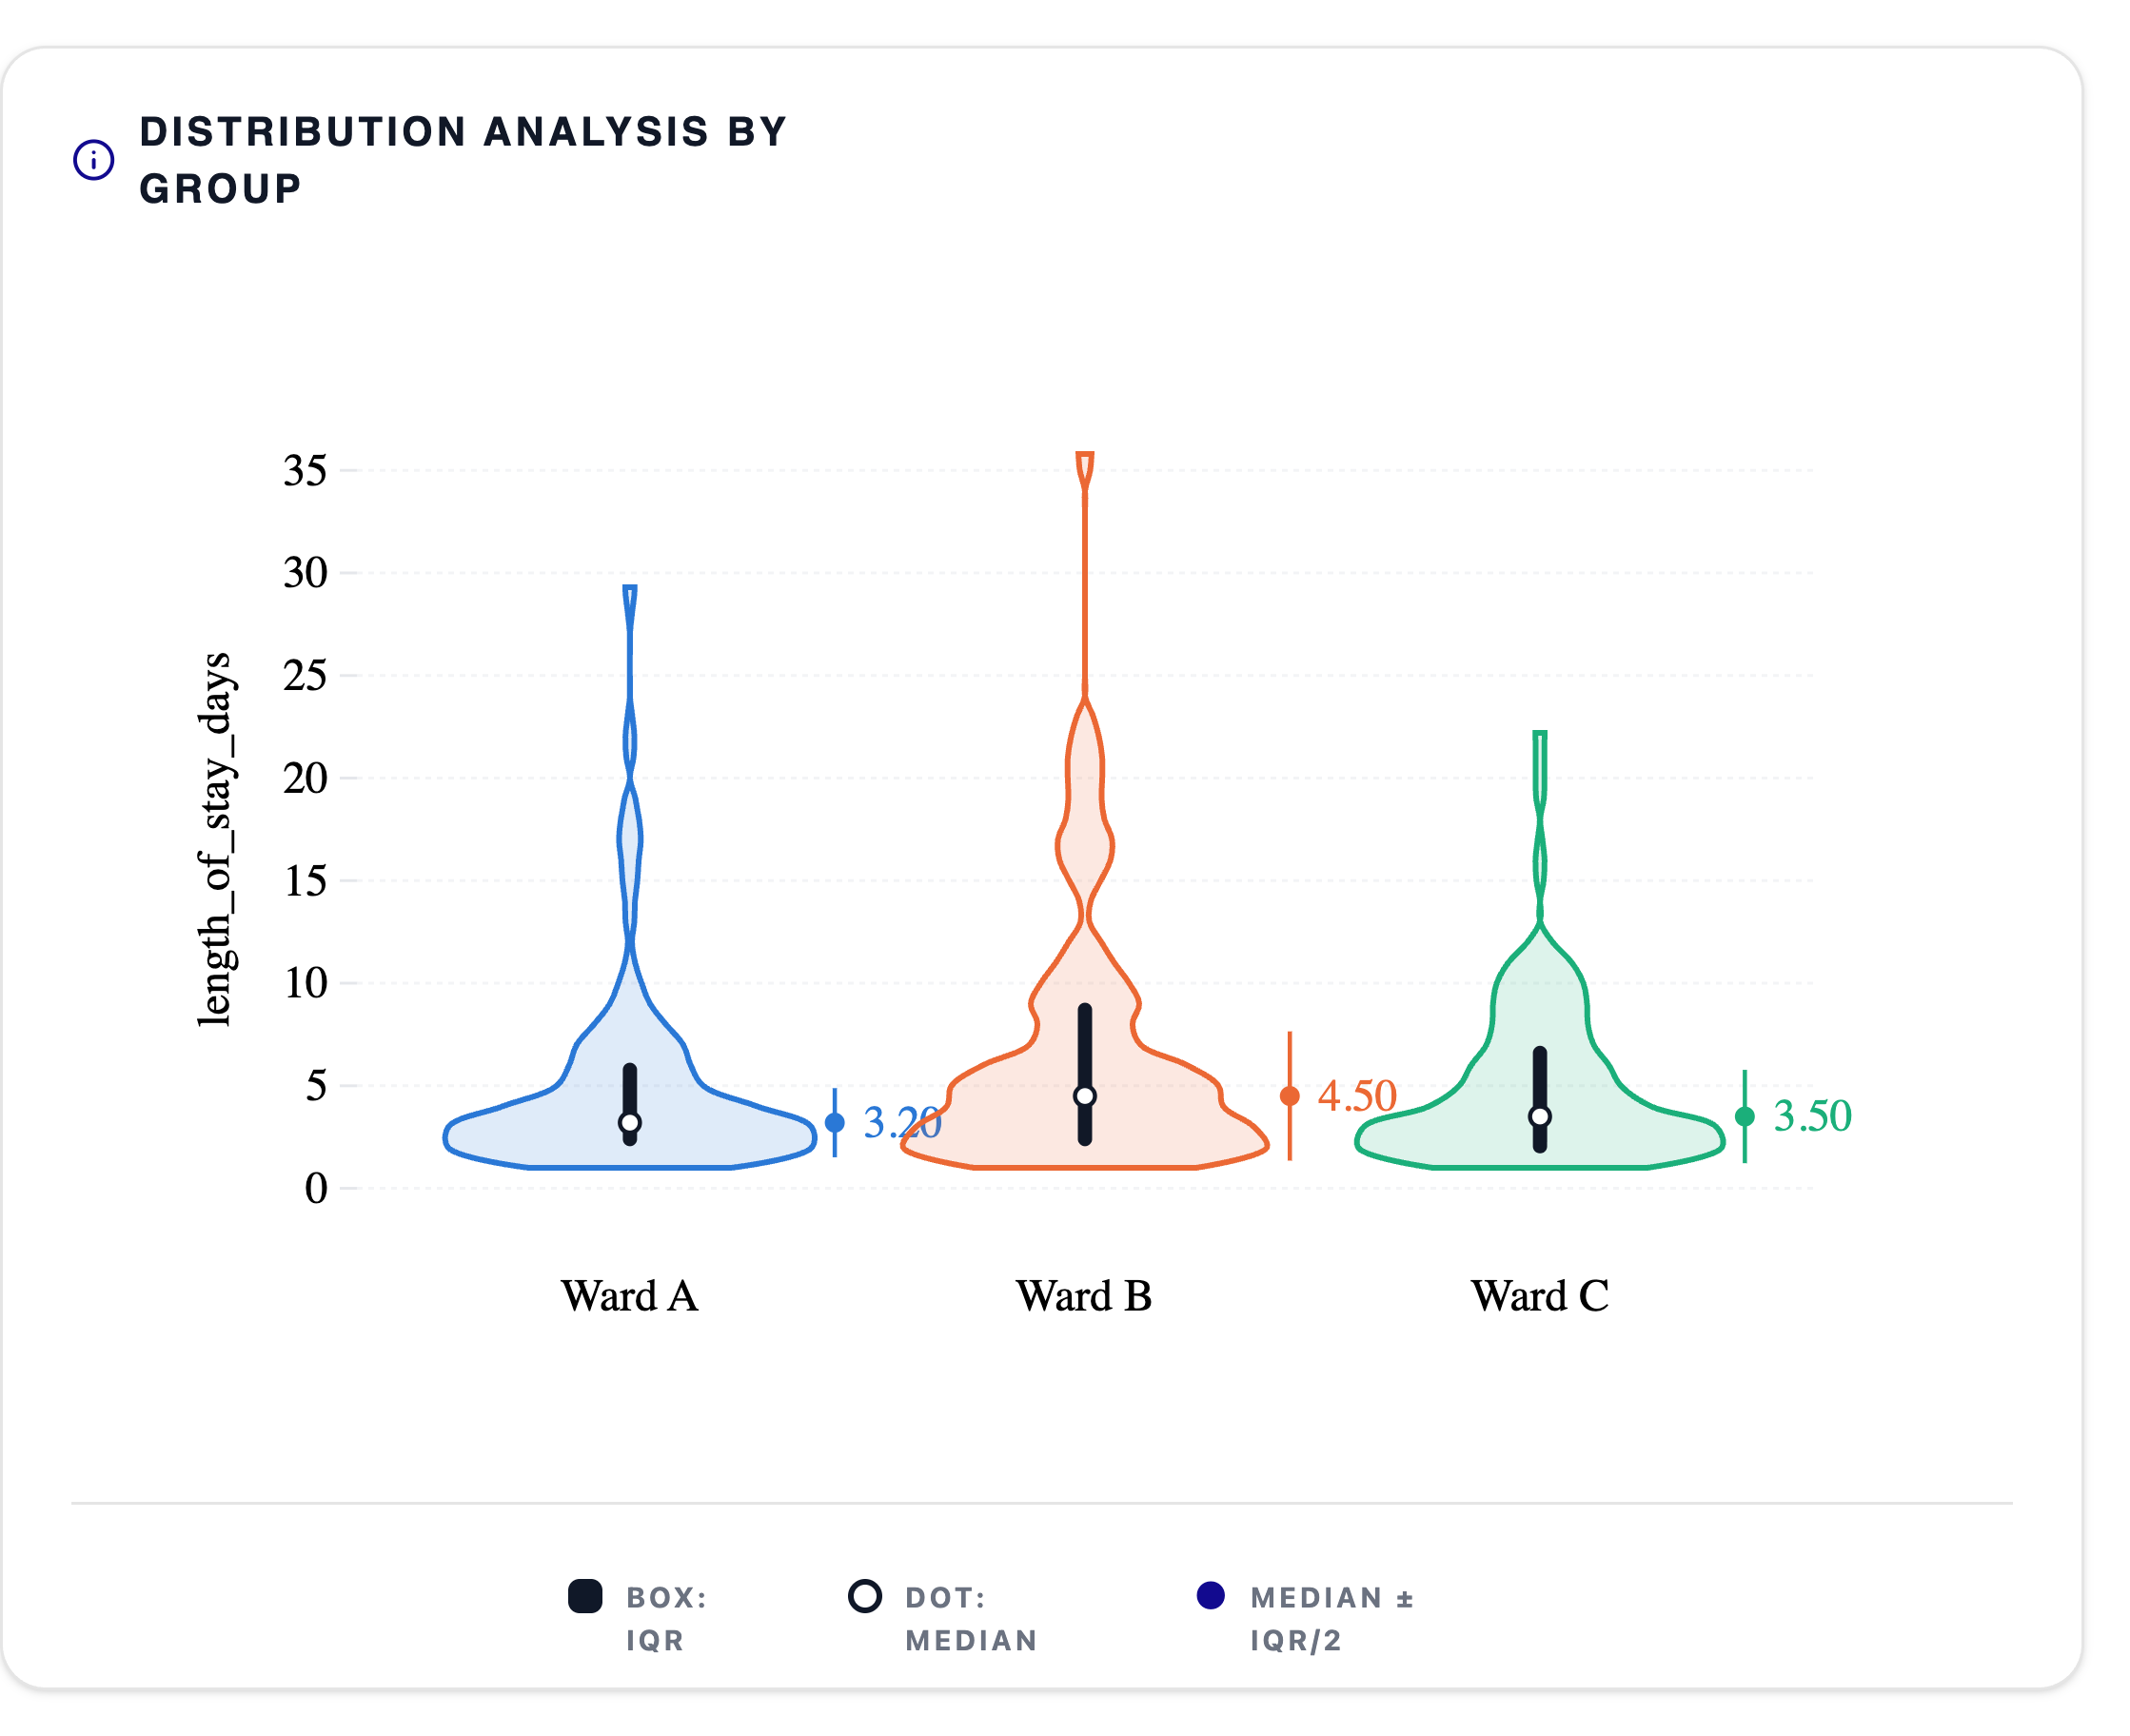
Every ward has the same shape: a dense clump at two to four days, then a thin tail — reaching 22 days on Ward C, 29 on Ward A and 36 on Ward B. That tail is what breaks the mean. On Ward B the mean stay is 6.7 days but the median is 4.5 — the mean describes a patient who does not exist, sitting above roughly two-thirds of the ward.
Note two things the tool does on its own here. It labels each ward with its median and IQR — 3.2, 4.5 and 3.5 days — rather than mean ± SD, because the distributions fail a normality check. And switching to the box view names the long stays for what they are:
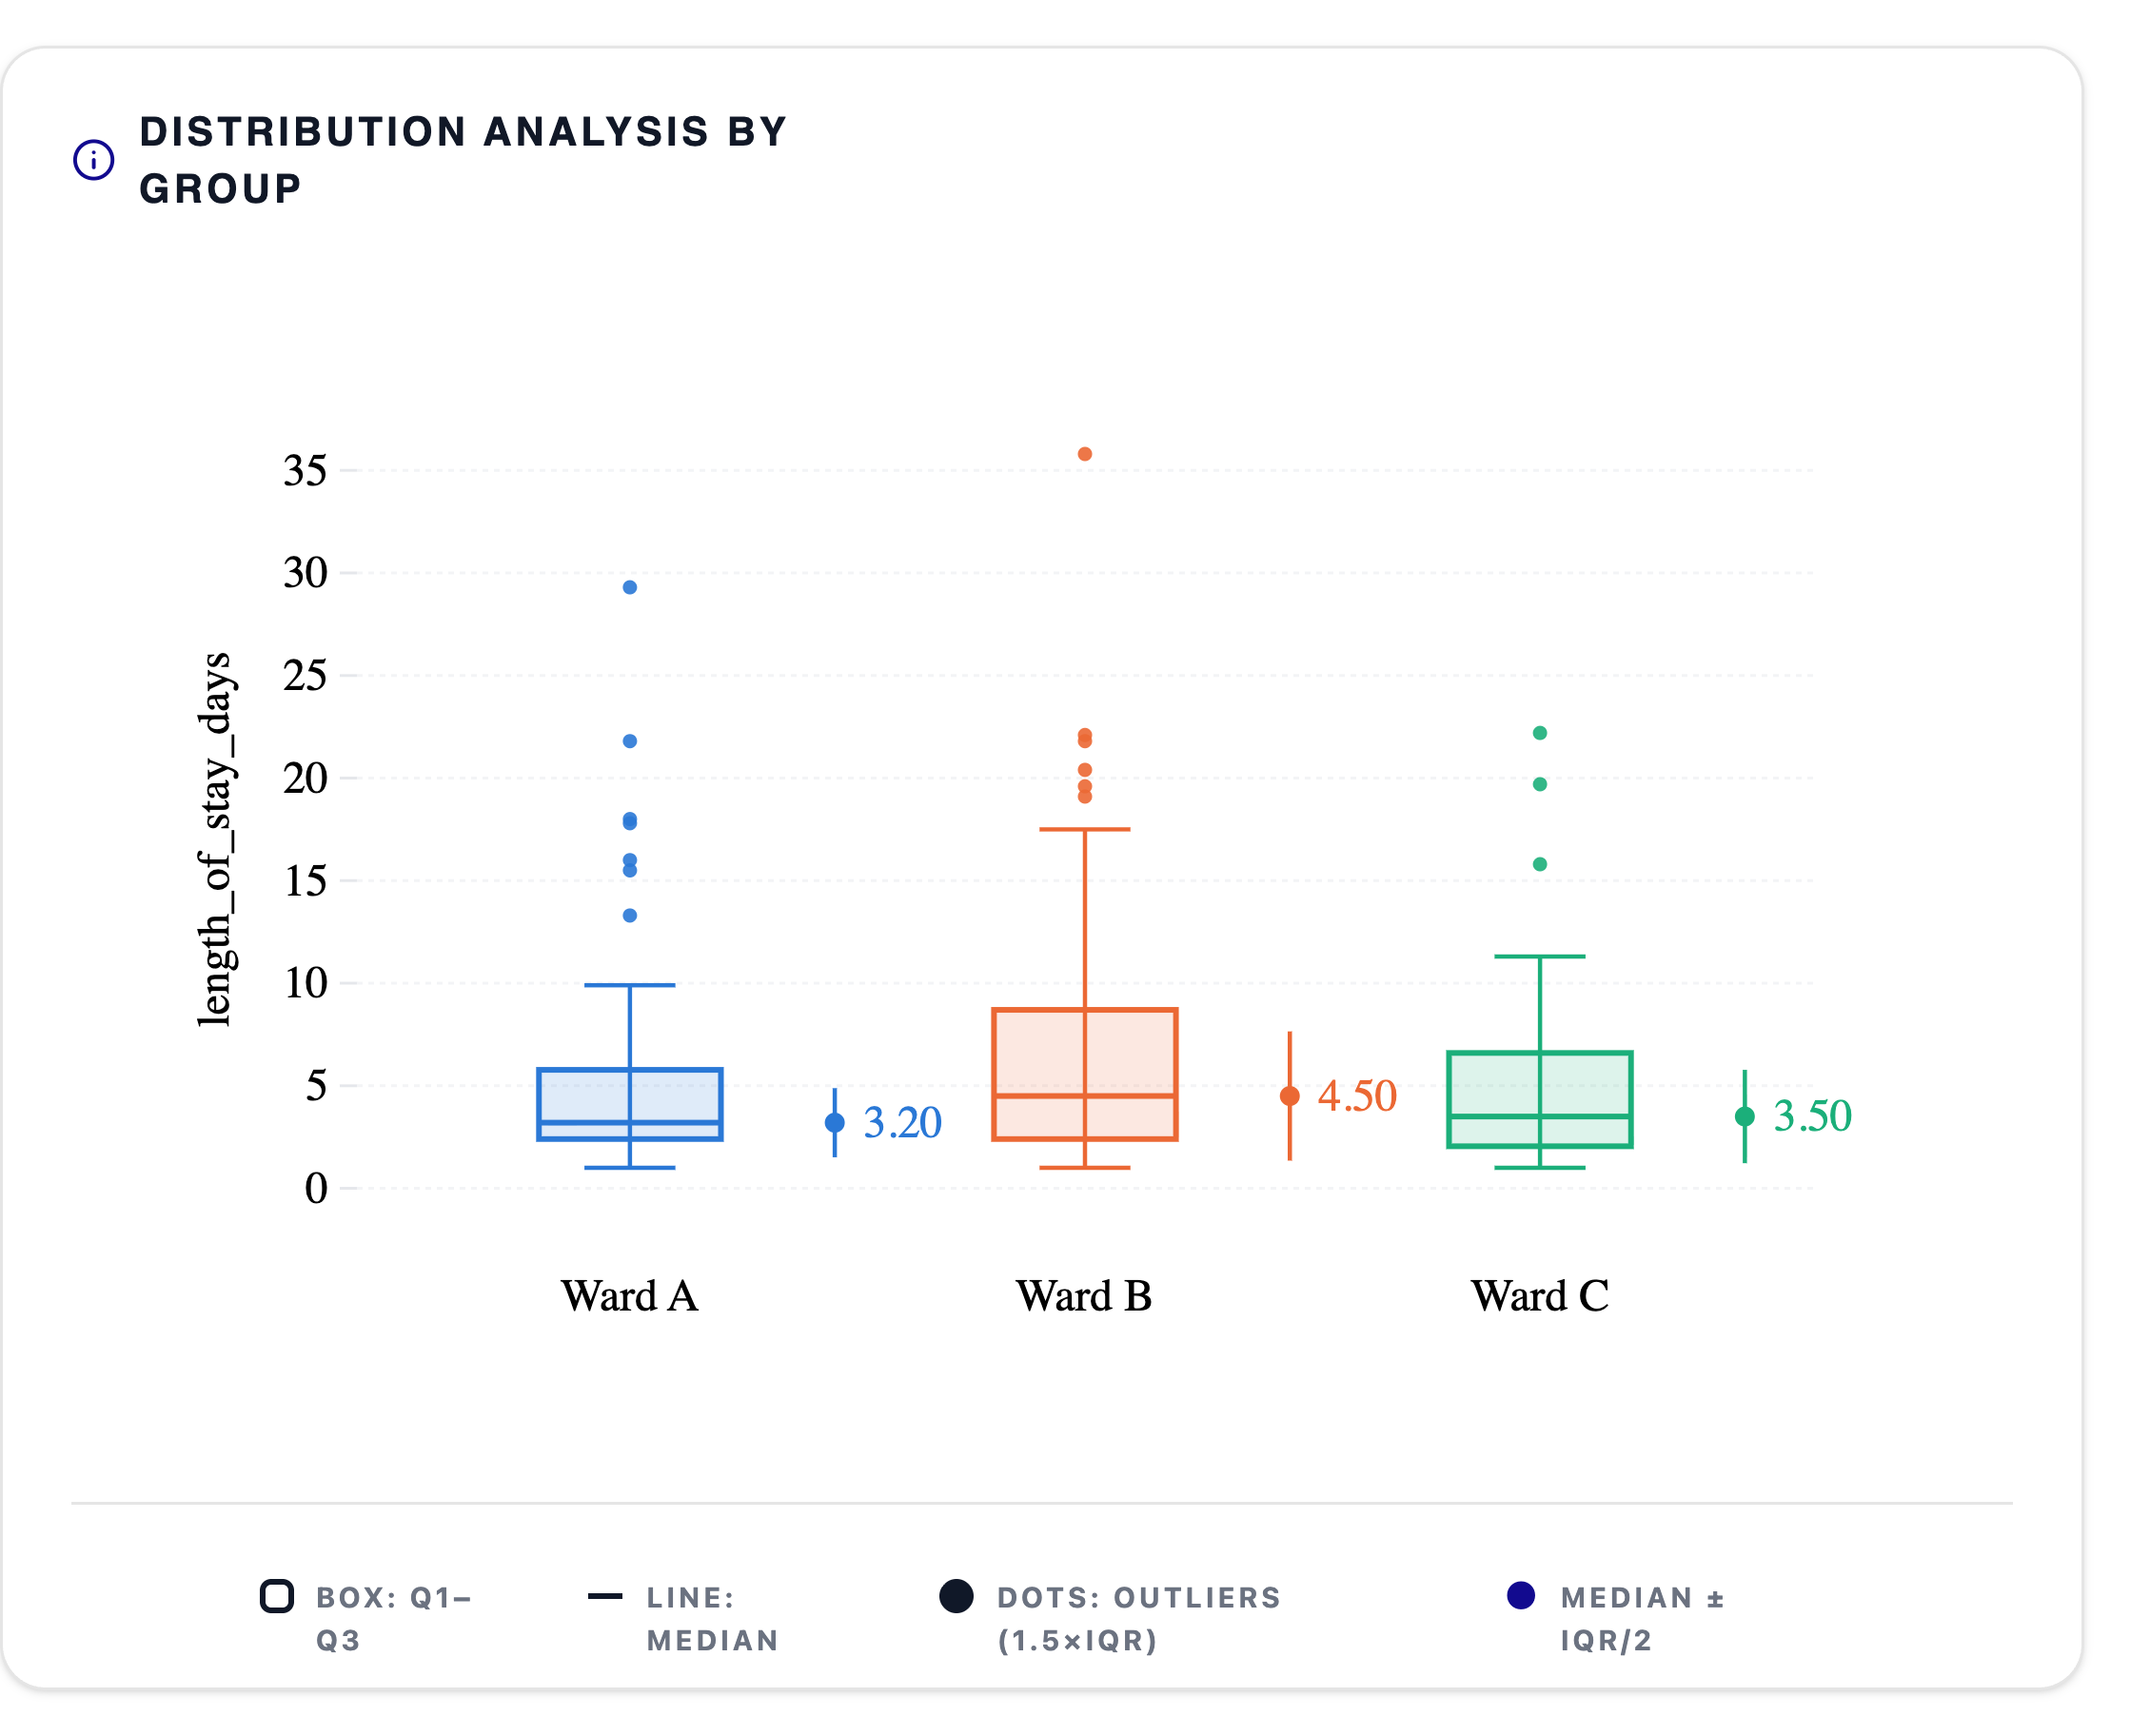
Every one of those dots is a real patient more than 1.5×IQR above the third quartile — seven on Ward A alone. They are not data errors to be cleaned away, and that is the whole problem. Each one drags its ward's mean upward: the means are 4.9, 6.7 and 4.9 days against medians of 3.2, 4.5 and 3.5, so every ward's mean overstates a typical stay by more than a day. A single 36-day admission on Ward B moves the mean and leaves the median untouched.
An ANOVA on this data would be testing differences in a summary (the mean) that misrepresents every group. Kruskal-Wallis, working in ranks, asks the question you actually mean: do patients on Ward B tend to stay longer than patients on Ward A?
Decision checklist
Run through these in order — the first row that matches your data is usually your test. Continuous outcome, roughly symmetric within groups, similar spreads: one-way ANOVA. Continuous, roughly symmetric, but clearly unequal spreads or very different group sizes: Welch's ANOVA. Heavily skewed outcome or influential outliers: Kruskal-Wallis. Ordinal outcome (Likert scales, grades, severity ratings): Kruskal-Wallis. Same subjects measured under 3+ conditions: that's a repeated-measures design — RM-ANOVA or Friedman, not either of these.
Two footnotes worth knowing. First, ANOVA is fairly robust to mild non-normality when groups are large and balanced — don't switch to Kruskal-Wallis over a marginally significant Shapiro-Wilk test on n = 200. Second, Kruskal-Wallis has assumptions too: for it to be read as a test of medians, the group distributions should have similar shapes. If shapes differ wildly, interpret it as a test of stochastic dominance — "values in group B tend to be larger" — which is often exactly what you want to say anyway.
Don't stop at the p-value
A significant Kruskal-Wallis (or ANOVA) only tells you some group differs. To find out which, you need post-hoc pairwise tests with multiplicity control: Tukey HSD after ANOVA, Games-Howell after Welch's ANOVA, and Dunn's test with Holm correction after Kruskal-Wallis. And report an effect size alongside the p-value: η² (eta-squared) for ANOVA, ε² (epsilon-squared) for Kruskal-Wallis. A p of .001 with ε² = 0.02 is a real but tiny effect; your readers deserve to know which.
Run it without second-guessing yourself
Inference's Guided Analysis asks you three plain-language questions — what your outcome is, how many groups, whether measurements are independent — checks your data's actual shape, and recommends exactly one test with the reasoning spelled out. If Kruskal-Wallis is significant, Dunn-Holm post-hocs run automatically, ε² is reported inline, and the built-in Statistical Reviewer drafts your Methods and Results paragraphs.
Try it free — upload your data and let Guided Analysis pick the test →
Related reading
- Which statistical test should I use? — the decision guide this article sits under.
- Welch's t-test vs Student's t-test — the same "unequal variance" problem, in the two-group case.
- P-value vs effect size — why ε² belongs beside your H statistic, and how to report it.
- Handling missing data — what to do before you compare groups at all.
References
The methods on this page are not our inventions — these are the primary sources. Where a claim here is contested in the literature, the reference is the place to check it rather than take our word for it.
- Kruskal, W. H., & Wallis, W. A. (1952). Use of ranks in one-criterion variance analysis. Journal of the American Statistical Association, 47.
- Welch, B. L. (1951). On the comparison of several mean values: an alternative approach. Biometrika, 38.
- Divine, G. W., Norton, H. J., Barón, A. E., & Juarez-Colunga, E. (2018). The Wilcoxon–Mann–Whitney procedure fails as a test of medians. The American Statistician, 72.
- Hart, A. (2001). Mann–Whitney test is not just a test of medians: differences in spread can be important. BMJ, 323.
FAQ
Is Kruskal-Wallis just an ANOVA on ranks? Nearly — the H statistic is closely related to an ANOVA computed on rank-transformed data. That intuition is fine for interpretation.
Does Kruskal-Wallis compare medians? Only when group distributions have similar shapes. In general it tests whether one distribution is shifted relative to the others.
What sample size do I need? The chi-square approximation works well when each group has 5+ observations. Below that, exact methods or caution are warranted.
What about ties in my data? Ties (repeated values, common in ordinal scales) require a tie correction to the H statistic. Inference applies it automatically, matching R and scipy.
Written by Dr Hoong Sern Lim MB ChB MD FRCP, Consultant Cardiologist, Queen Elizabeth Hospital Birmingham; Honorary Senior Lecturer, University of Birmingham. ORCID 0000-0002-6569-1805