Handling Missing Data: A Practical Guide (Why Mean Imputation Fails)
How to handle missing data in research: MCAR vs MAR vs MNAR, why mean imputation biases results, when complete-case is fine, and when to use multiple imputation (MICE).
Every real dataset has holes. What you do about them changes your results more than most analysis choices — yet missing data is the step researchers most often handle with a default they never questioned. This guide covers the three questions that matter: why is the data missing, how much is missing, and what role does the variable play — and turns the answers into a defensible plan.
First, understand why it's missing
Statisticians classify missingness into three mechanisms, and the right treatment depends on which one you're facing.
MCAR (missing completely at random): the holes have nothing to do with anything — a dropped test tube, a skipped page. Deleting incomplete rows loses power but introduces no bias.
MAR (missing at random, given what you observed): missingness depends on other measured variables. Older patients skip more blood-pressure measurements; sicker patients miss follow-up visits that are recorded elsewhere. This is the common case in practice — and the one where your choice of method really matters.
MNAR (missing not at random): missingness depends on the unobserved value itself — the highest earners decline the income question. No statistical method can fully fix MNAR; you handle it with sensitivity analyses and honest limitations. Importantly, you cannot prove which mechanism you have from the data — you can only gather evidence and judge plausibility.
Here's what MAR looks like when you go looking for it:
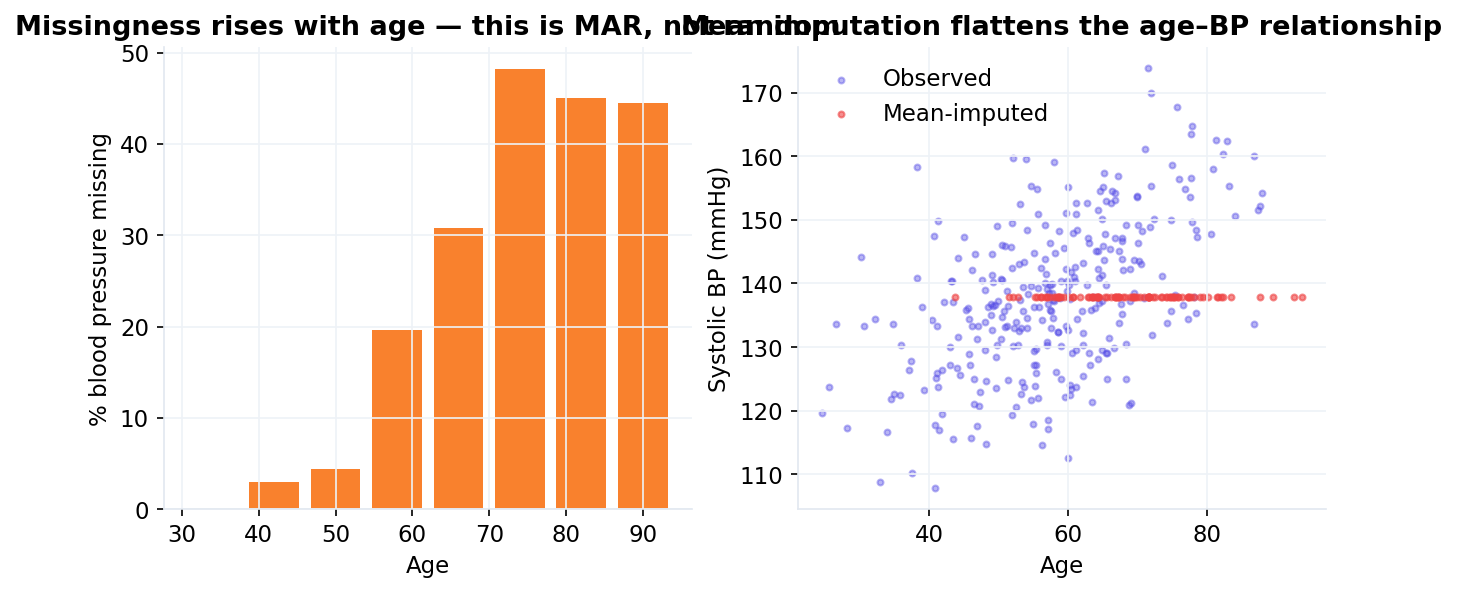
The left panel shows blood-pressure missingness climbing with age — evidence against MCAR. The right panel previews the damage a naive fix does: mean-imputed values (red) form a horizontal bar that ignores the age–BP relationship entirely.
Why mean imputation fails
Mean imputation feels safe — you're not "making up" anything extreme. But it does three bad things at once: it shrinks the variance (every imputed value sits exactly at the center), it flattens relationships (imputed points carry zero correlation with everything), and it fakes certainty (your software treats imputed values as real data, so confidence intervals come out too narrow). The damage is visible in the estimates:
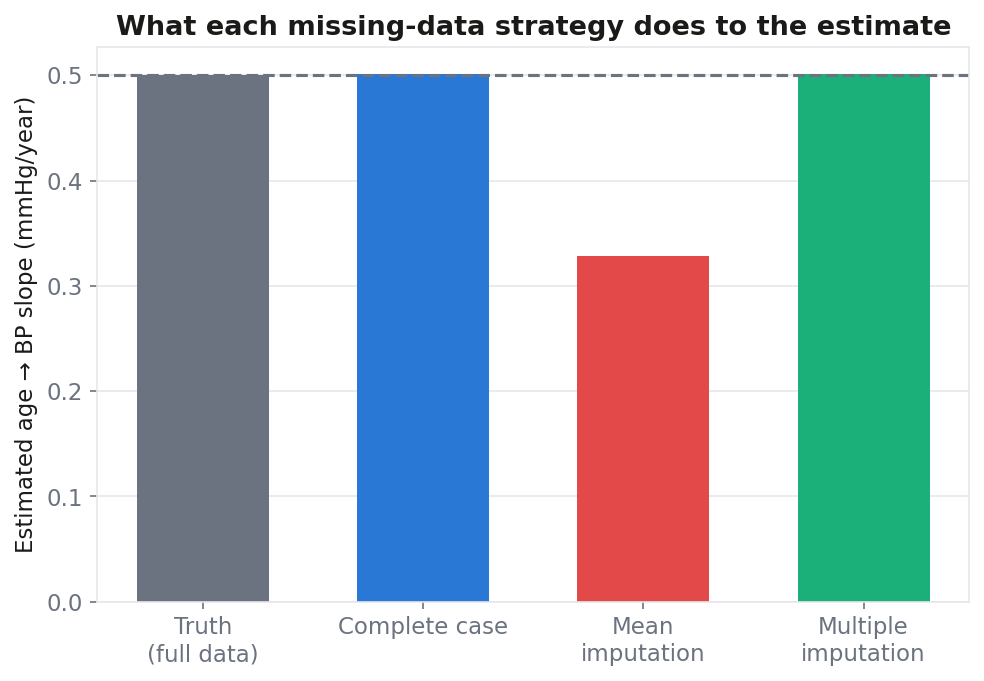
With 30% of BP values missing (more often in older patients), mean imputation drags the estimated age→BP slope well below the truth. Complete-case analysis holds up better here — and multiple imputation recovers the truth while honestly widening the uncertainty.
A practical decision guide
Under ~5% missing and no pattern? Complete-case analysis (dropping incomplete rows) is fine — say so in Methods and move on. Missing values in your outcome? Don't impute them for inferential analyses; imputed outcomes add noise, not information. A predictor missing 5–40% with MAR evidence? This is multiple imputation's home turf. Building a prediction model? Simpler imputation (kNN or median) inside the cross-validation loop is acceptable — plus a missing-indicator column, since the fact of missingness often predicts. Time-ordered measurements? Interpolation between adjacent observations is legitimate — but only for series data; never interpolate "between" unrelated patients. Over ~40% missing? No method rescues that variable honestly; consider dropping it and saying why.
Multiple imputation, in one paragraph
MICE (Multivariate Imputation by Chained Equations) fills each hole not once but m times (typically 20), drawing plausible values from a model built on the other variables, with deliberate randomness reflecting real uncertainty. You run your analysis on all m completed datasets and pool the results with Rubin's rules, which combine within-imputation and between-imputation variance. The payoff: unbiased estimates under MAR and honest confidence intervals — the thing single imputation can never give you. One habit beats every method choice: run it both ways. If your complete-case and imputed analyses agree, report either with confidence. If they flip your conclusion, that's the finding — your result is fragile to missing-data assumptions, and readers need to know.
How Inference handles this for you
Upload your data and the Data Health check flags hidden missing-value codes (those −99s and 999s that silently poison means), maps which columns are missing together, and screens for MAR patterns. The missing-data recommender then suggests a defensible method based on your goal, the variable's role, and the missing rate — never mean imputation for inference — and one click runs it, including full MICE with Rubin-pooled regression (m = 20, validated against R's mice). A sensitivity check compares your complete-case and imputed results side by side and tells you whether your conclusion holds or flips. The Methods paragraph writes itself — literally.
Upload your data and see what's hiding in the holes — free →
Related reading
- Which statistical test should I use? — the decision guide this article sits under.
- P-value vs effect size — imputation widens confidence intervals honestly; here is how to read them.
- Kruskal-Wallis vs ANOVA — once the data are complete, choosing the right comparison.
- Competing risks in survival analysis — censoring is not missingness, and the distinction matters.
References
The methods on this page are not our inventions — these are the primary sources. Where a claim here is contested in the literature, the reference is the place to check it rather than take our word for it.
- Rubin, D. B. (1976). Inference and missing data. Biometrika, 63.
- White, I. R., Royston, P., & Wood, A. M. (2011). Multiple imputation using chained equations: issues and guidance for practice. Statistics in Medicine, 30.
- Sterne, J. A. C., White, I. R., Carlin, J. B., Spratt, M., Royston, P., Kenward, M. G., Wood, A. M., & Carpenter, J. R. (2009). Multiple imputation for missing data in epidemiological and clinical research: potential and pitfalls. BMJ, 338.
- Little, R. J. A., & Rubin, D. B. (2019). Statistical Analysis with Missing Data (3rd ed.). Wiley.
FAQ
How much missing data is too much? There's no hard cutoff, but above ~40% per variable, imputation is doing more modeling than measuring. Below 5%, almost anything defensible works.
Is deleting rows (listwise deletion) always bad? No — under MCAR (or with very little missingness) it's unbiased, just less powerful. Its real danger is silent sample shrinkage: five variables each missing 10% can drop 40% of your rows.
How many imputations do I need? Old advice said 5; modern practice says 20+ or roughly the percentage of incomplete cases. More imputations = more stable pooled SEs.
Can I impute categorical variables? Yes — MICE handles them with logistic (binary) or multinomial (3+ levels) models. Mode imputation is only acceptable for tiny amounts of missingness.
Written by Dr Hoong Sern Lim MB ChB MD FRCP, Consultant Cardiologist, Queen Elizabeth Hospital Birmingham; Honorary Senior Lecturer, University of Birmingham. ORCID 0000-0002-6569-1805