P-values vs Effect Sizes: What a Significant Result Actually Tells You
Why p < .05 doesn't mean important: how to interpret p-values and effect sizes together, what confidence intervals add, and how to report results reviewers trust.
Three studies each report p = .04. One found something that could change practice; one found something real but trivial; one found something too noisy to interpret. If "p < .05" is all you read — or all you report — you cannot tell them apart. This article is about the number that separates them.
What a p-value is (and isn't)
A p-value answers one narrow question: if there were truly no effect, how surprising would data like mine be? Small p = surprising = evidence against "no effect." That's all. A p-value is not the probability your hypothesis is wrong, not the probability the result replicates, and — the mistake that matters most — not a measure of how big or important the effect is. Because p depends on sample size as much as on effect: with n = 20,000, a difference too small to matter clinically will glow "significant"; with n = 20, a large real effect can miss the cutoff.
Same p, three different findings
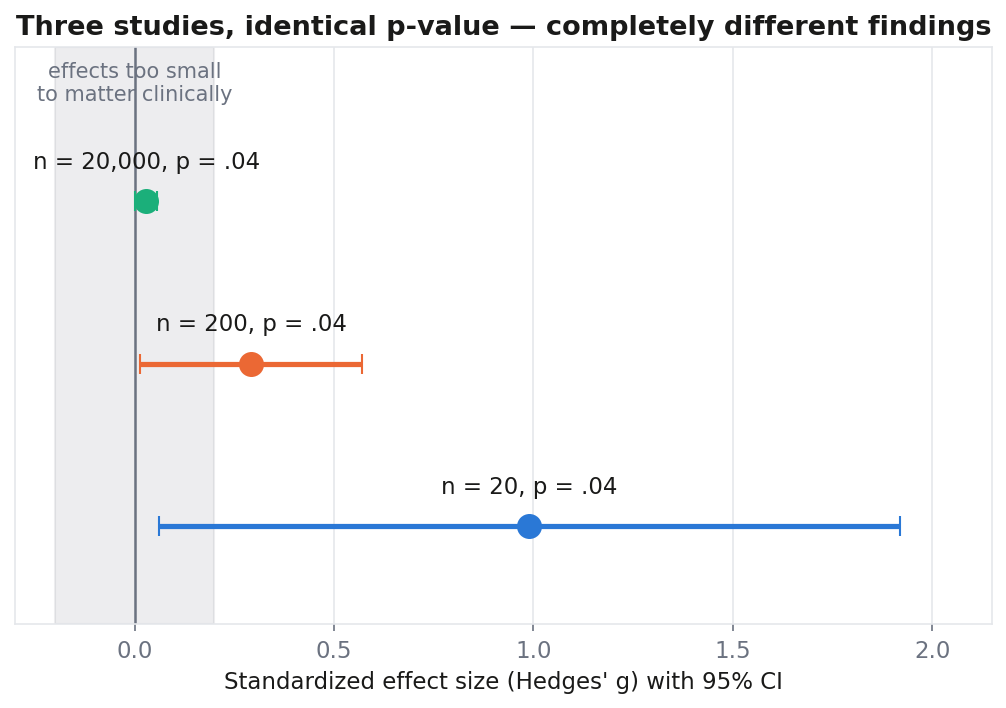
All three studies above have p = .04. The small study (blue) estimates a large effect with a confidence interval so wide it's compatible with anything from modest to enormous — promising, but fragile. The mid-size study (orange) pins down a modest effect with decent precision. The huge study (green) has precisely measured an effect so small it sits inside the "too small to matter" zone — statistically significant and practically meaningless. Identical p-values; incompatible conclusions. The effect size and its interval, not p, carry the story.
The two-question habit
Read every result by asking, in order: How big is it? (effect size and its units — the mean difference in mmHg, the odds ratio, Hedges' g) and How precisely do we know? (the 95% CI — and specifically whether the whole interval clears the threshold of practical importance). The p-value then adds one refinement: whether the direction is established at all. For standardized effects, the conventional benchmarks — g ≈ 0.2 small, 0.5 medium, 0.8 large — are rough furniture, not laws; an effect that's "small" by Cohen's rule can matter enormously at population scale (aspirin's effect on heart attacks is tiny by g and has saved many thousands of lives).
The two mistakes that survive peer review
Reading p ≥ .05 as "no effect." Absence of evidence is not evidence of absence — a non-significant result with a wide CI means we couldn't tell, not there's nothing there. If you want to claim two treatments are equivalent, that requires its own method (TOST equivalence testing with a pre-declared margin), not a failed significance test. Reading p < .05 as "important." Statistical significance is a statement about signal versus noise, never about magnitude. The green study above is the cautionary tale: real, certain, and irrelevant.
Both errors dissolve the moment the effect size and CI are printed next to the p-value — which is why good journals now require it, and why a sentence like this should be your template: "The intervention reduced systolic BP by 8.2 mmHg (95% CI 3.1–13.3; g = 0.62), t(56.5) = 3.2, p = .002." Size, precision, evidence — in that order.
Built to be misread-proof
Inference prints the effect size (Hedges' g, dz, η², ε², Cramér's V — matched to the test) with its confidence interval inline on every result card, next to the p-value, so magnitude is never an afterthought. The built-in Statistical Reviewer goes further: it flags exactly the two mistakes above in your own analysis — warning when you're about to read non-significance as equivalence (and offering the TOST test instead), and when a significant p is paired with a trivial effect — then drafts results sentences in the size-precision-evidence format reviewers want.
Analyze your data with effect sizes built in — free →
Related reading
- Which statistical test should I use? — the decision guide this article sits under.
- Kruskal-Wallis vs ANOVA — choosing the test that makes your effect size meaningful.
- Welch's t-test vs Student's t-test — the two-group version of the same question.
- Competing risks in survival analysis — where the wrong estimand inflates the effect itself.
References
The methods on this page are not our inventions — these are the primary sources. Where a claim here is contested in the literature, the reference is the place to check it rather than take our word for it.
- Wasserstein, R. L., & Lazar, N. A. (2016). The ASA statement on p-values: context, process, and purpose. The American Statistician, 70.
- Greenland, S., Senn, S. J., Rothman, K. J., Carlin, J. B., Poole, C., Goodman, S. N., & Altman, D. G. (2016). Statistical tests, P values, confidence intervals, and power: a guide to misinterpretations. European Journal of Epidemiology, 31.
- Cohen, J. (1994). The earth is round (p < .05). American Psychologist, 49.
- Amrhein, V., Greenland, S., & McShane, B. (2019). Scientists rise up against statistical significance. Nature, 567.
FAQ
Is p = .049 different from p = .051? Not meaningfully — the .05 line is a convention, not a cliff. Treat p as continuous evidence and lean on the CI.
Which effect size should I report? Match it to the analysis: mean differences and Hedges' g for t-tests, η²/ε² for ANOVA-family tests, odds or hazard ratios for logistic/Cox models, Cramér's V for contingency tables. Always with a CI when available.
Can I claim "no difference" from p = .60? No — you can claim equivalence only via an equivalence test (TOST) against a margin you justify. Otherwise say "no evidence of a difference," which is weaker and honest.
Do I still need p-values at all? They're still the accepted currency for "is the direction established," and journals expect them. The argument here isn't against p — it's against p alone.
Written by Dr Hoong Sern Lim MB ChB MD FRCP, Consultant Cardiologist, Queen Elizabeth Hospital Birmingham; Honorary Senior Lecturer, University of Birmingham. ORCID 0000-0002-6569-1805