Which Clustering Algorithm Should I Use? K-means, DBSCAN, or GMM
K-means vs DBSCAN vs Gaussian mixture models: how to choose a clustering algorithm, pick k with elbow and silhouette plots, and validate that your clusters are real.
Clustering looks like one task — "find the groups in my data" — but the three workhorse algorithms make different assumptions about what a group is. Choose against the shape of your data and you'll get confident, colorful, wrong clusters. Here's how to choose, how to pick the number of clusters, and how to check the clusters are real.
What each algorithm assumes a cluster is
K-means assumes clusters are compact, round blobs of similar size. It places k centers and assigns every point to its nearest center — which means its boundaries are always straight lines. Fast, interpretable, and the right default when your groups plausibly are blobs (patient phenotypes on standardized labs, customer segments on spend metrics).
DBSCAN assumes clusters are dense regions separated by sparse ones — any shape at all. It needs no k; instead you set a neighborhood radius (eps) and a minimum density. Its superpower: points in no dense region are labeled noise rather than forced into a cluster. Its cost: two sensitive parameters, and trouble when clusters have very different densities.
Gaussian mixture models (GMM) assume clusters are ellipses with possibly different sizes and spreads, and return probabilities of membership rather than hard assignments — a patient can be 70% phenotype A, 30% phenotype B. The right choice when boundaries are genuinely fuzzy and you want to say so.
The assumption difference isn't academic — it's visible:
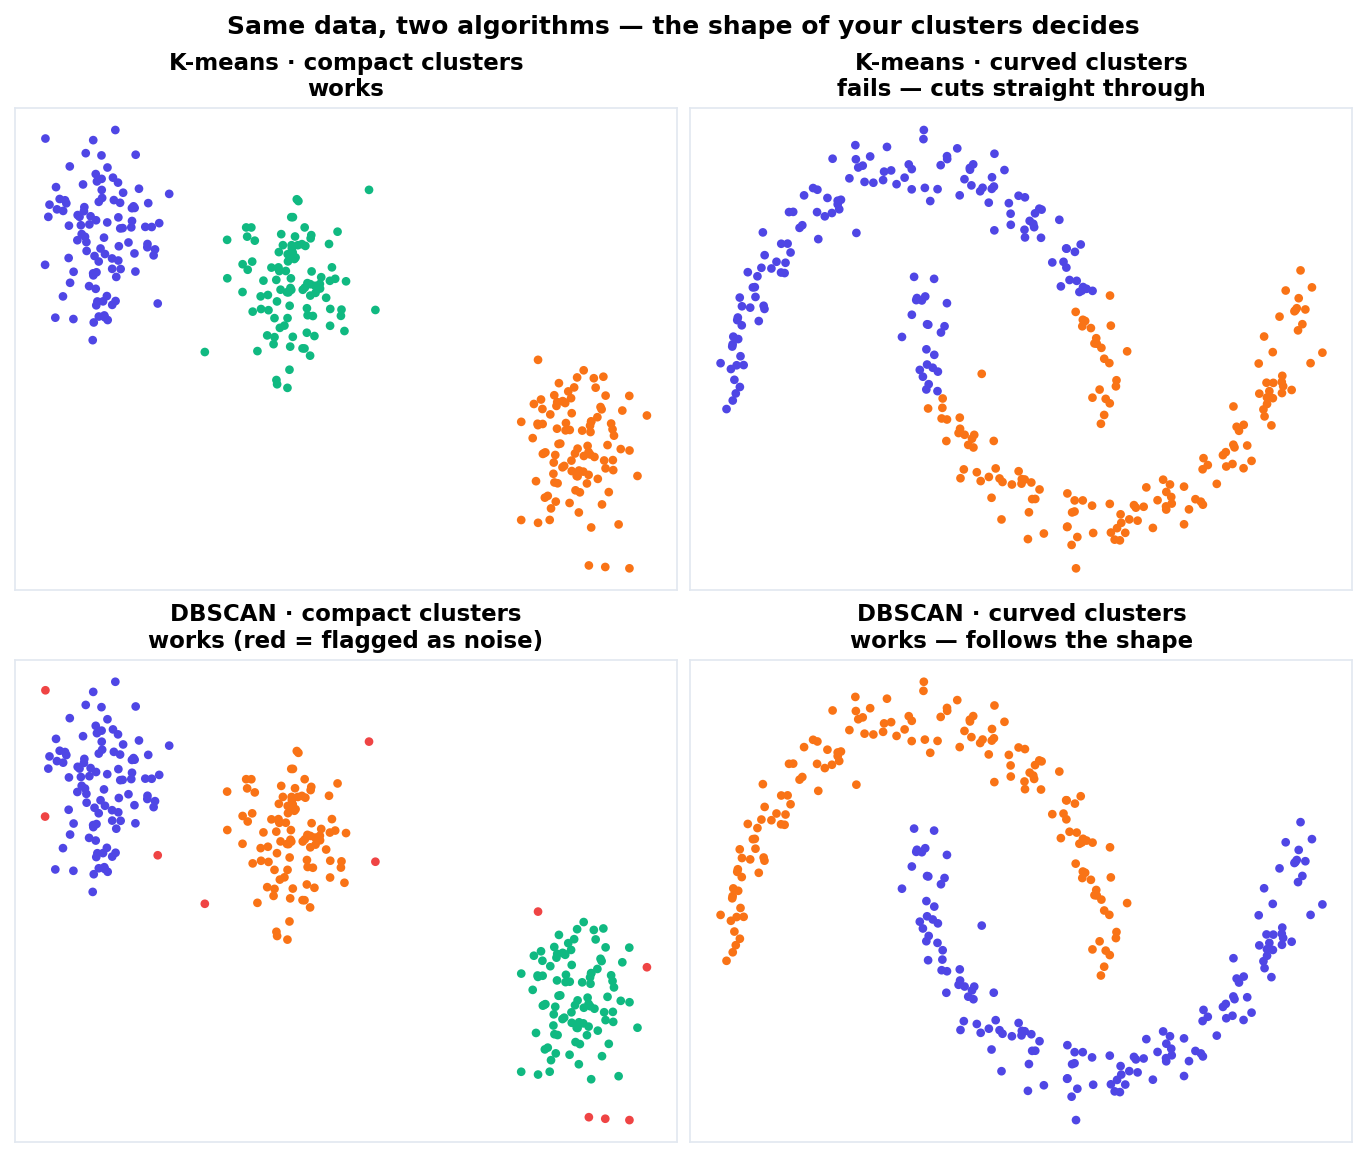
On compact blobs (left), both algorithms agree. On curved, interlocking groups (right), k-means slices straight through both crescents — it cannot draw a curved boundary — while DBSCAN follows the shape and flags stragglers as noise.
How many clusters? Elbow and silhouette
For k-means and GMM you must choose k, and two standard plots keep you honest. The elbow plot shows within-cluster scatter as k grows: look for the bend where adding clusters stops paying. The silhouette score (−1 to 1) measures how much closer each point is to its own cluster than the next-best one: pick the k that maximizes it, and treat averages below ~0.25 as evidence of weak structure.
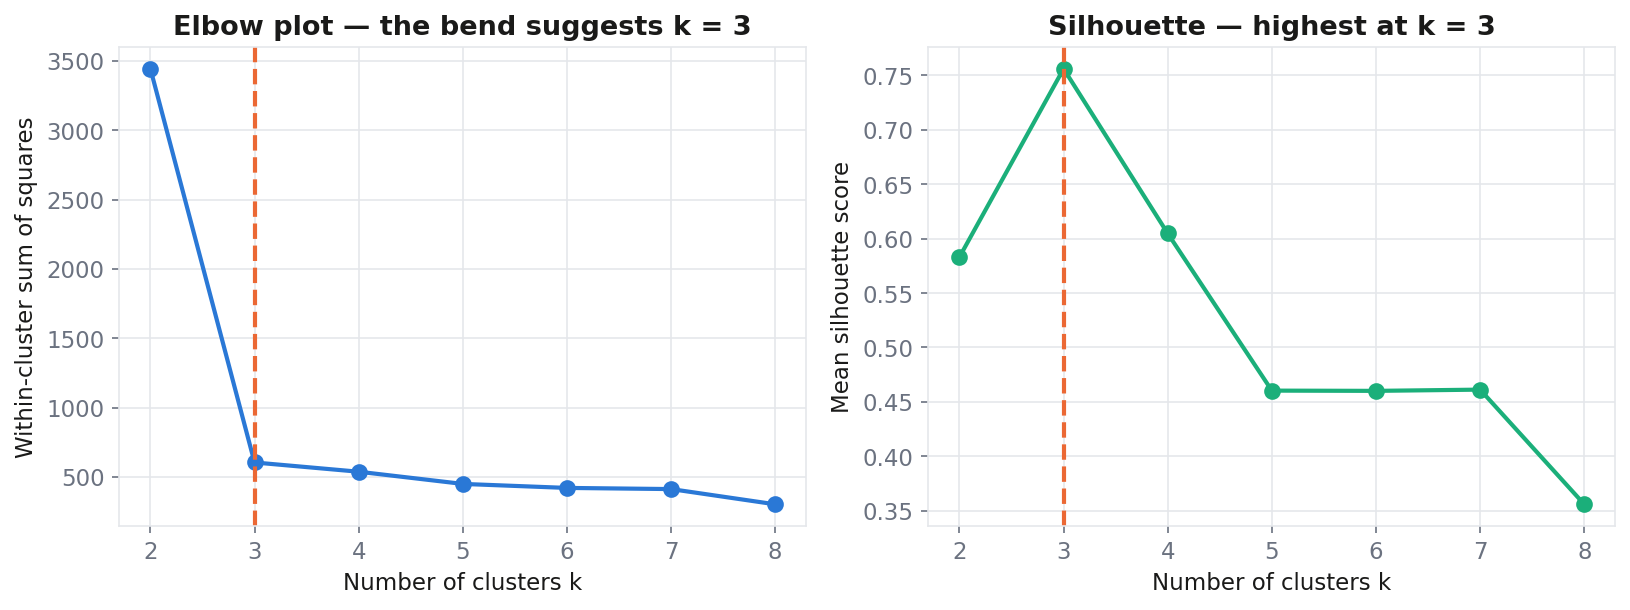
When both plots point at the same k, proceed with reasonable confidence. When they disagree — or the silhouette is low at every k — take seriously the possibility that your data has no clusters, and everything you're seeing is an algorithm dutifully partitioning a cloud.
Three practical rules before you cluster anything
Standardize your variables. K-means and DBSCAN live on distances; an income column in dollars will drown an age column in years. Standardization (z-scoring) puts variables on equal footing — it should be your default, on by default.
Don't feed in dozens of correlated variables. Distance loses meaning in high dimensions. Run PCA first and cluster the top components, or select the variables that matter substantively.
Validate before you narrate. The failure mode of clustering isn't a crashed algorithm — it's a plausible story told about arbitrary groupings. Check the silhouette, check stability (do clusters survive resampling?), and check that clusters differ on variables you didn't cluster on. A "frailty phenotype" that doesn't differ in outcomes is a scatterplot, not a phenotype.
Quick chooser
Groups are plausibly round and similar-sized, you want speed and interpretability: k-means. Odd shapes, unknown k, or you specifically want outliers surfaced: DBSCAN. Overlapping groups, soft membership, unequal spreads: GMM. Mostly you want fewer dimensions, not groups: PCA first. You want anomalies, not clusters: use a dedicated outlier method (LOF, Mahalanobis) rather than reading DBSCAN's noise as a finding.
Clustering with a guide at your side
Inference runs k-means (with elbow plot and silhouette guidance), DBSCAN, GMM, and PCA, plus LOF and Mahalanobis outlier detection — with standardization on by default and every algorithm validated against scikit-learn. After each run, a guidance panel reads your silhouette and cluster sizes and suggests the next move in plain language ("k=4 splits a real cluster in two — try k=3", "12% noise: lower eps or switch to k-means"). When you're satisfied, Save Clusters writes the labels back to your dataset so you can test whether your clusters differ on outcomes — the validation step that makes clusters science.
Find the real groups in your data → — Clustering is part of Pro; a free account covers the data tools, Explore and group comparisons.
Related reading
- Which statistical test should I use? — the decision guide this article sits under.
- Handling missing data — distance-based clustering has no answer for a blank cell; fix it first.
- P-value vs effect size — why "the clusters differ significantly" is the wrong claim to chase.
- Kruskal-Wallis vs ANOVA — comparing an outcome across the clusters you just found.
References
The methods on this page are not our inventions — these are the primary sources. Where a claim here is contested in the literature, the reference is the place to check it rather than take our word for it.
- Rousseeuw, P. J. (1987). Silhouettes: a graphical aid to the interpretation and validation of cluster analysis. Journal of Computational and Applied Mathematics, 20.
- Ester, M., Kriegel, H.-P., Sander, J., & Xu, X. (1996). A density-based algorithm for discovering clusters in large spatial databases with noise. Proceedings of KDD-96.
- Hennig, C. (2015). What are the true clusters? Pattern Recognition Letters, 64.
- von Luxburg, U., Williamson, R. C., & Guyon, I. (2012). Clustering: science or art? JMLR Workshop and Conference Proceedings, 27.
FAQ
Do I need to standardize before clustering? Almost always yes for distance-based methods. Skip it only when variables share a natural common scale.
What silhouette score is "good"? Above 0.5: strong structure. 0.25–0.5: weak but possibly real. Below 0.25: little evidence of clusters.
Can I cluster categorical data? Not well with these three (they're built on numeric distance). Dummy-code sparingly, or use methods designed for mixed data.
How is anomaly detection different from clustering? Clustering finds the groups; anomaly detection finds the points that belong to none. DBSCAN incidentally does both, but dedicated methods (LOF, Mahalanobis) rank how unusual each point is.
Written by Dr Hoong Sern Lim MB ChB MD FRCP, Consultant Cardiologist, Queen Elizabeth Hospital Birmingham; Honorary Senior Lecturer, University of Birmingham. ORCID 0000-0002-6569-1805